Introduction
The migration of people from rural areas to urban areas around the world1 has been a persistent topic of research, with a focus on the relationship between agricultural changes, urbanisation, and economic growth.2 This migration trend has continued for several centuries3 and is expected to continue to intensify.4
Northern Norway specifically, has been the centre of attention for population-related policy-making since 1951, when the Norwegian government launched a development program5 to prevent unemployment and migration away from the region. A series of measures has been implemented to stabilise the population in the region, including the creation of an action zone in 1990.6 Nevertheless, Northern Norway has continued to face significant population challenges due to aging and outward migration.
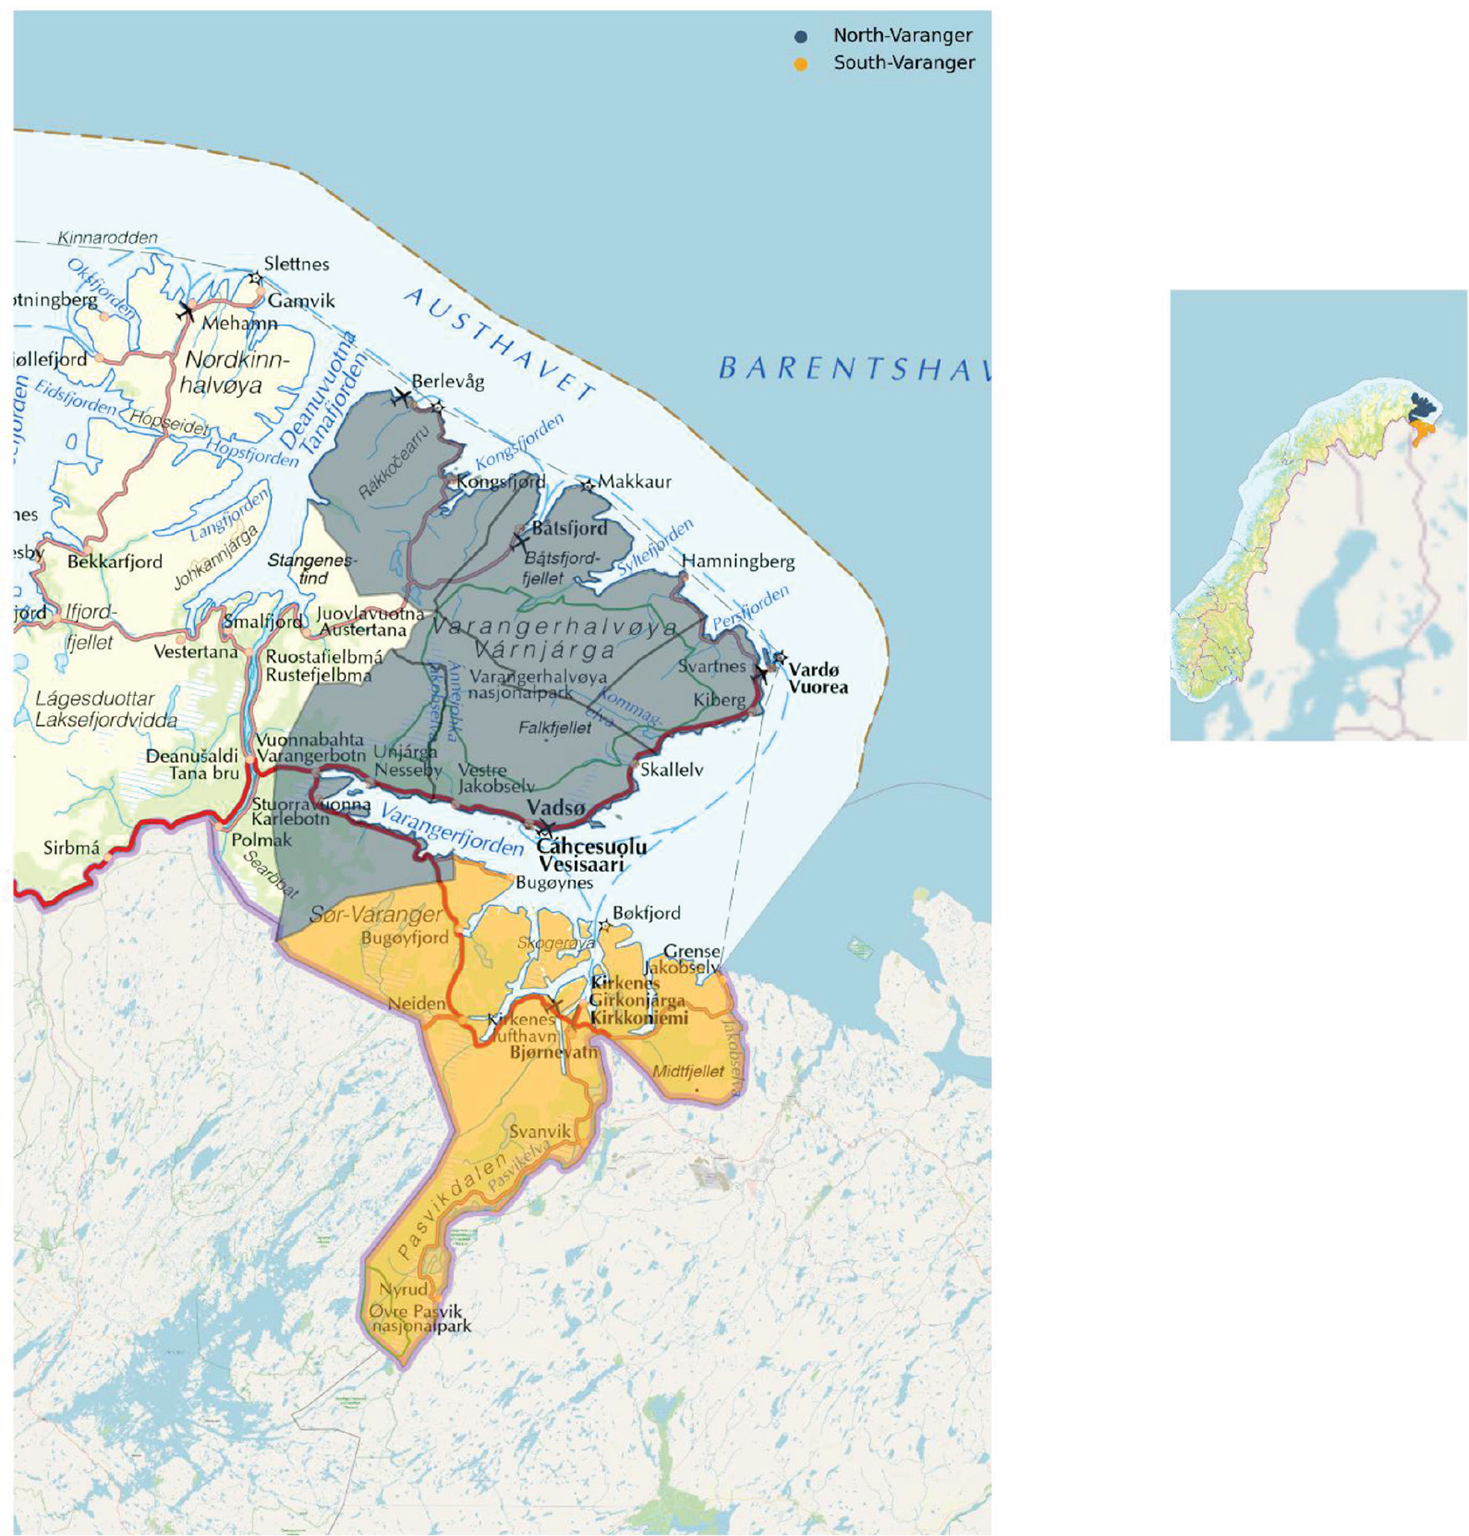
The issue of aging and outward migration has been even stronger in North-Varanger than in the rest of Northern Norway. North-Varanger is a peninsula in north-eastern Norway, north of the Varanger Fjord and east of the Tana Fjord. The area consists of five local municipalities: Nesseby municipality (864 residents as of 1 January 2023), Vadsø municipality (5,593), Vardø municipality (1,933), Båtsfjord municipality (2,117) and Berlevåg municipality (908). The peninsula covers an area of 5,853 square kilometres with a total population of 11,415. North-Varanger is shown in Figure 1, together with South-Varanger and the surrounding regions.
Norway’s easternmost point is located in Vardø in North-Varanger. While Norway’s land border with Russia is entirely in the municipality of South-Varanger, North-Varanger is nonetheless an area of strategic importance to Norway due to its proximity to the Russian border. As such, maintaining permanent population of both North- and South-Varanger may be important for national security. This importance has only been highlighted by the war in Ukraine.
Figures 2 and 3 show net migration and excess births over deaths in Northern Norway and North-Varanger from 1951 to the present.7
The figures show a decrease in the surplus of births over deaths, with North-Varanger experiencing more deaths than births since 2010. Negative net migration has been consistently observed in both Northern Norway and North-Varanger. The only exceptions were a period of net migration to North-Varanger in the early 1990s and net migration to both Northern Norway and North-Varanger from 2008 to 2015. The latter period followed the eastern expansion of the Schengen Agreement, which led to a surge in immigration to the north.
Figure 4 shows the population changes in North-Varanger, both for immigrants and the rest of the population. Non-immigrants have only experienced net inward internal migration in two years since 1987: 1992 and 1994. In the 34-year period from 1987 to 2020, the total net outward migration of non-immigrants was over 4,800 individuals. With a negative surplus of births over deaths and significant net outward migration, high immigration has been the sole factor with a positive effect on North-Varanger’s population numbers. However, since 2017, this has stopped, with more immigrants leaving the region than entering it.8
Ottar Brox’ book Hva skjer i Nord-Norge [What’s happening in Northern Norway]9 was groundbreaking for academic and political debate about regional policy in Norway and development in the north. Later contributions to the discussion have emphasised the continued challenge of migration from the region.10 At the same time, the authorities have repeated ambitious targets for settlement in Norway’s rural regions. A 2020 report on regional policy from the Solberg government to the Norwegian Parliament states that “the government wants vibrant local communities and growth throughout the whole country”11 (authors’ translation). This seems less committal than a previous formulation in a 2013 report from the Stoltenberg government, which stated that “The government aims to preserve the distinct features of our settlement patterns”12 (authors’ translation).

Source: Statistics Norway

Source: Statistics Norway

Source: Statistics Norway
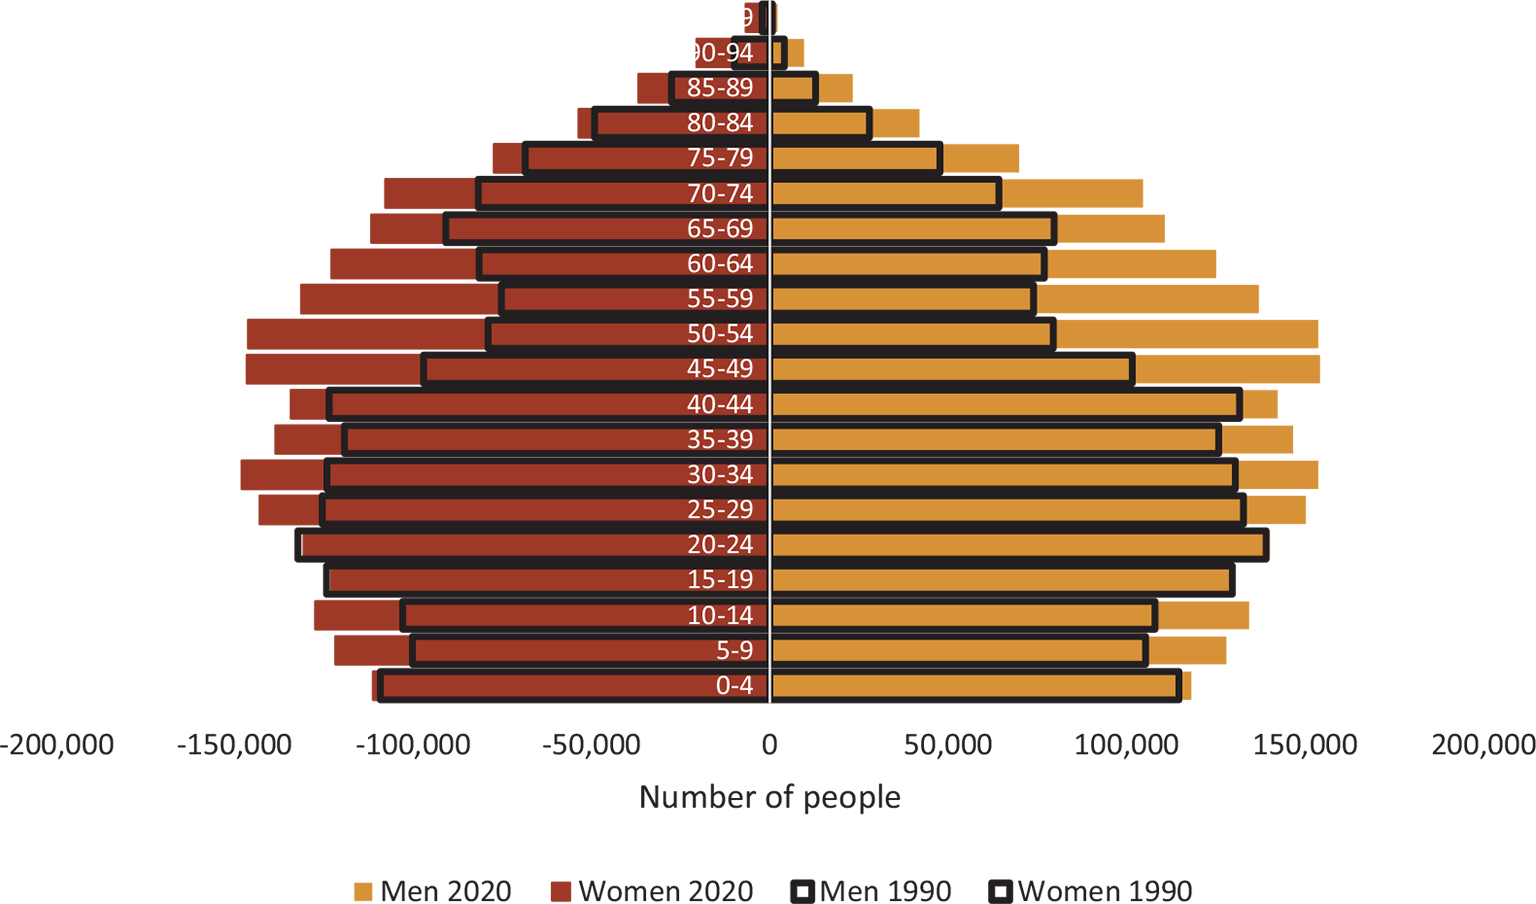
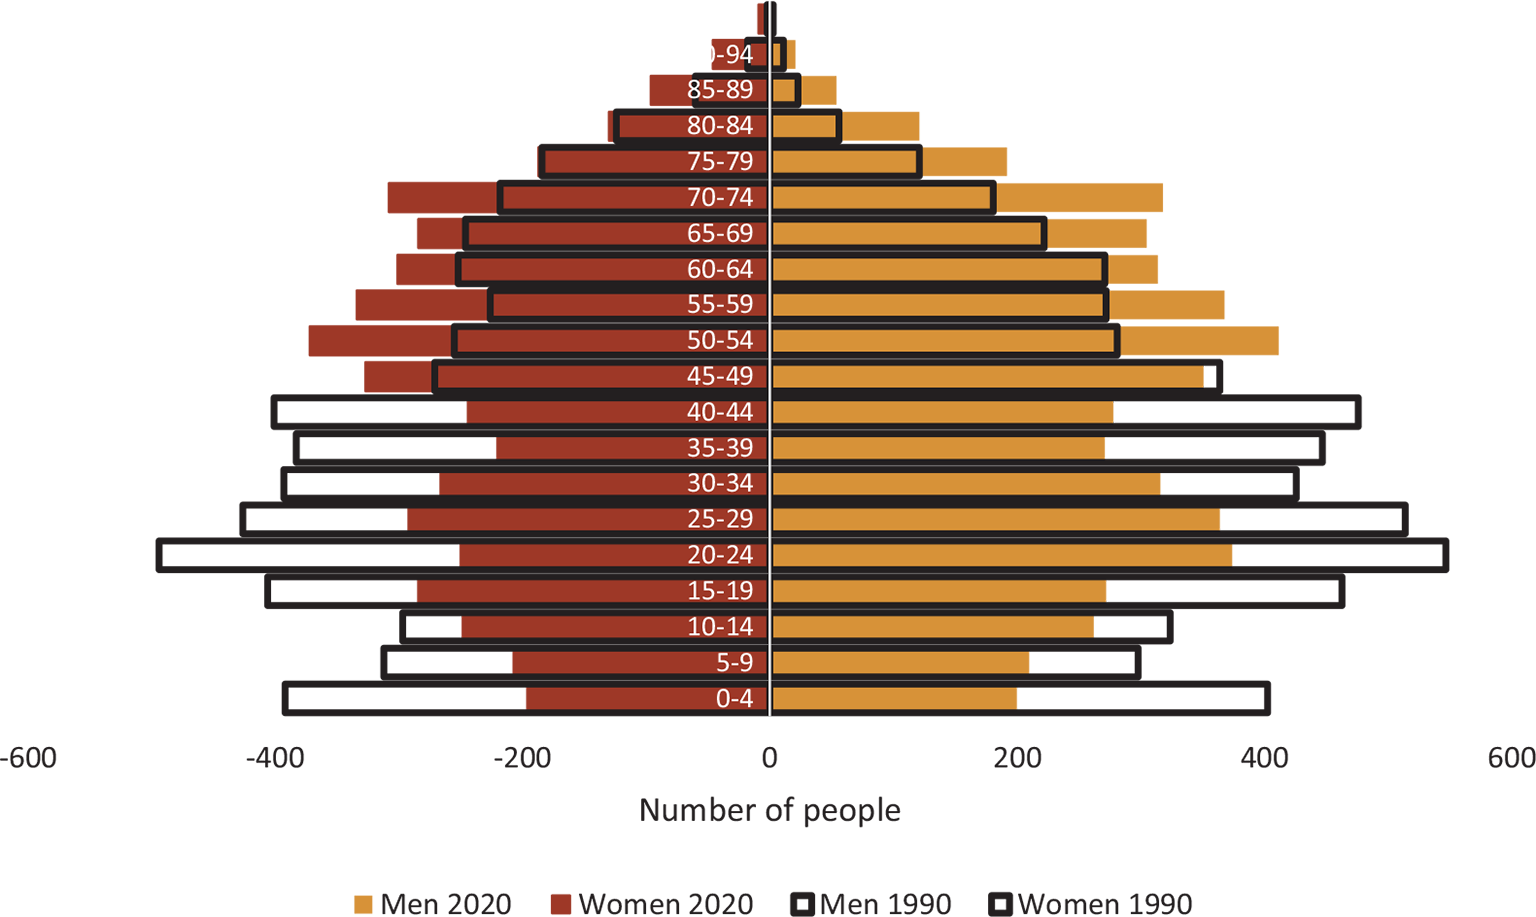
One potential reason for the reduced ambition is that the rural regions of Norway have already experienced changes in population composition, which makes it significantly more challenging to preserve existing settlement patterns. As shown in Figures 5 and 6, the population in Norway and North-Varanger has shifted from 1990 to 2020. While both areas have experienced an increase in the number of elderly individuals, North-Varanger has seen a significant decline in the number of young people, in contrast to Norway as a whole, which has seen a rise in the number of young people. In 2020 there were less than half as many 0–4-year-olds in North-Varanger as there were in 1990.
The tendency is that young people move away from North-Varanger and do not have children in the region. As a result, each age group is smaller than the one before it. This trend is expected to continue.
Two public advisory committees have recently delivered recommendations to the government where they highlight the challenges that may follow from the changes in population composition. The committee on demographic developments in rural Norway13 states that:
The rural regions are no longer able to reproduce themselves, much less supply the cities with people. If settlement in these regions is to be ensured, the net flow of people must therefore go from more central to less central areas14
Source: Statistics Norway
Source: Statistics Norway
Along similar lines, the committee on commerce and industry in the rural regions of Norway15 points out that:
one of the most important driving forces for the centralization of the population in recent decades is the demographic starting point…. This has contributed to a birth deficit, particularly in the least central municipalities.… The age composition in municipalities in rural regions as a whole is significantly more skewed today than 20 years ago, with an even lower proportion of people of childbearing age. This points to an additional birth deficit in the future16
This issue has not received much attention in academic and political discussions, except for concerns about how to address the challenges posed by an aging population and the associated funding and service needs. Current population projections from Statistics Norway cover only the period up to 2050, but it would be valuable to consider the longer-term implications of these demographic changes. As people continue to age, the number of deaths will also increase, while a decline in the number of people of childbearing age will affect the size of future cohorts of childbearing age. Therefore, there is a need for new research on how changes in population composition will affect population numbers towards the end of the century. While uncertainty increases the further we look into the future, many decisions are ultimately made with a longer perspective than the current 30-year population projections. Given its unique history and strategic significance, North-Varanger could be an especially interesting case study, both in terms of its own regional development and as an example of the broader challenges facing rural Norway.
Methodology
In this study, we propose a stock-flow model to project the population of North-Varanger in the forthcoming years. Our model estimates the number of individuals of different ages and sexes from 2021 to 2100. Specifically, we estimate the number of people that are 0 years, 1 year, 2 years, 3 years, etc. per sex per year. We take into account the impact of birth rates, mortality rates, and migration patterns on the population size and age structure.
We adopt a year-on-year estimation method, where the population of each year is estimated based on the population figures of the previous year, in addition to the predicted number of births, deaths, and migration events.
There are four main variables in the model:
1. The mortality rates for every age cohort and sex, spanning from 2021 to 2100. This allows us to estimate the number of deaths for each age group in the population over the projection period.
2. The fertility rate, which represents the birth rates by age of the mother for each year between 2021 and 2100. This affects the number of new births expected in the region, taking into account the age distribution of the female population.
3. Net immigration per year for each age cohort and sex for each year between 2021 and 2100. This factor accounts for the number of people entering or leaving the region due to immigration over the projection period.
4. The net internal migration rate within Norway for each year between 2021 and 2100, which measures the share of the population moving away from the region each year for each age cohort and sex.
We use these assumptions to calculate three main factors: number of births, number of deaths, and net outward migration. The first projected year of the model is 2021, and the final year 2100.
To calculate the number of deaths for each sex and age cohort in a given year, we multiply the population from the previous year by the corresponding death rate. Technically, this is formulated as
Similarly, the number of people moving out of the region is estimated as the product of the population from the previous year and the net internal migration rate.
The number of new births is estimated by summing the products of the female population in each age group and the corresponding birth rate.
For all age groups other than newborns, we estimate the population for a given year using a stock-flow equation that takes into account the population from the previous year, number of deaths, net internal migration, and net immigration.
To illustrate, the number of 35-year-olds in 2024 is calculated as the number of 34-year-olds in 2023, minus all 34-year-olds who died, minus all 34-year-olds who moved away, plus all 35-year-olds who immigrated.
The reason for separating net internal migration and net immigration, is that these have had very different trends, and their forward trajectories may vary substantially. Net immigration to North-Varanger has been very volatile, while net internal migration among the local population has remained constant and negative.
This model predicts the population depending on the four different assumptions. In the section below, we discuss what would be logical assumptions.
Data and model assumptions
The model operates at the level of each municipality in North-Varanger and projects the population for each year from 2021 to 2100. The model draws upon data from four main sources, namely mortality rates, birth rates, net immigration, and net internal migration rates within Norway. Going forward, these four factors will be the determining factors for the population in North-Varanger.
Mortality rates: Mortality rates are estimated using forecasts from Statistics Norway for each municipality up to 2050. After this period, it is assumed that mortality rates for each municipality will change by the same percentage change as the national forecasts from Statistics Norway.
Birth rates: Birth rates in North-Varanger, Finnmark, the rest of Norway and most of the world, have been falling over the past couple of decades. The Total Fertility Rate (TFR), which is a measure of how many children, on average, a woman will have in her lifetime, has fallen substantially over the past 50 years. In Finnmark, the TFR was over 3 in 1970, before falling to approximately 2 in 1990 and 1.56 in 2019. There is a large uncertainty in whether the trend of a falling TFR will continue, or if it will reverse. SSB forecasts in their main scenario that the fertility rate will increase to slightly over 1.7 and stabilise. Past research has, however, pointed out that SSB has repeatedly overestimated future fertility rates.17 Furthermore, there was an additional dip in the TFR in 2022, dropping to 1.35 in the county of Troms and Finnmark. Although the TFR in 2022 was most likely affected by the pandemic, it nonetheless shows that the TFR has continued to fall, rather than increase. We therefore find little basis to forecast an increase in the fertility rate. In the main scenario, we therefore forecast no change in the total fertility rate, and that it remains at 1.56. In the sensitivity, we include scenarios where the TFR increases as Statistics Norway forecasts.
As the data source, we use SSB’s estimates for projected birth rates for 2021 for each county in North-Varanger. This provides similar results to those using observed data for Finnmark from 2019, but avoids the issue of overfitting estimates to small area populations, which is highlighted as problematic by several researchers.18 Figure 7 shows the used estimates for children per 1000 women, along with the observed numbers for Finnmark in 2019.
Net immigration
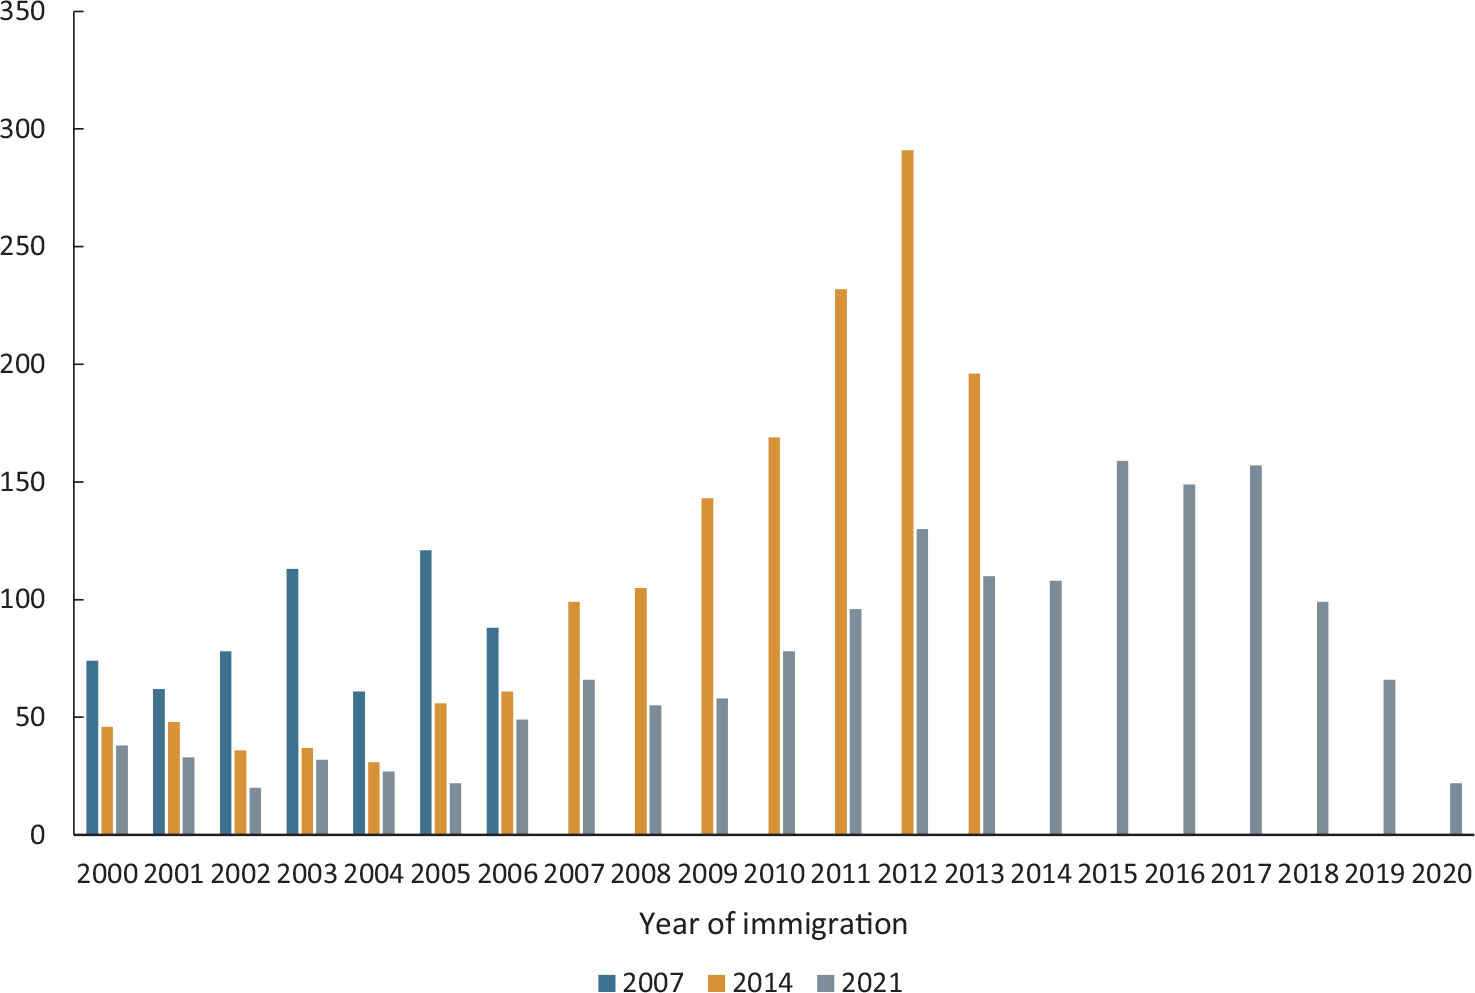
There has been substantial reported immigration to North-Varanger. In the decade following the Schengen expansion to the east, there was a high level of immigration to the region. Over the past decade, however, the number of immigrants living in North-Varanger has remained relatively unchanged, and the number in 2021 was indeed a few percent lower than in 2014.

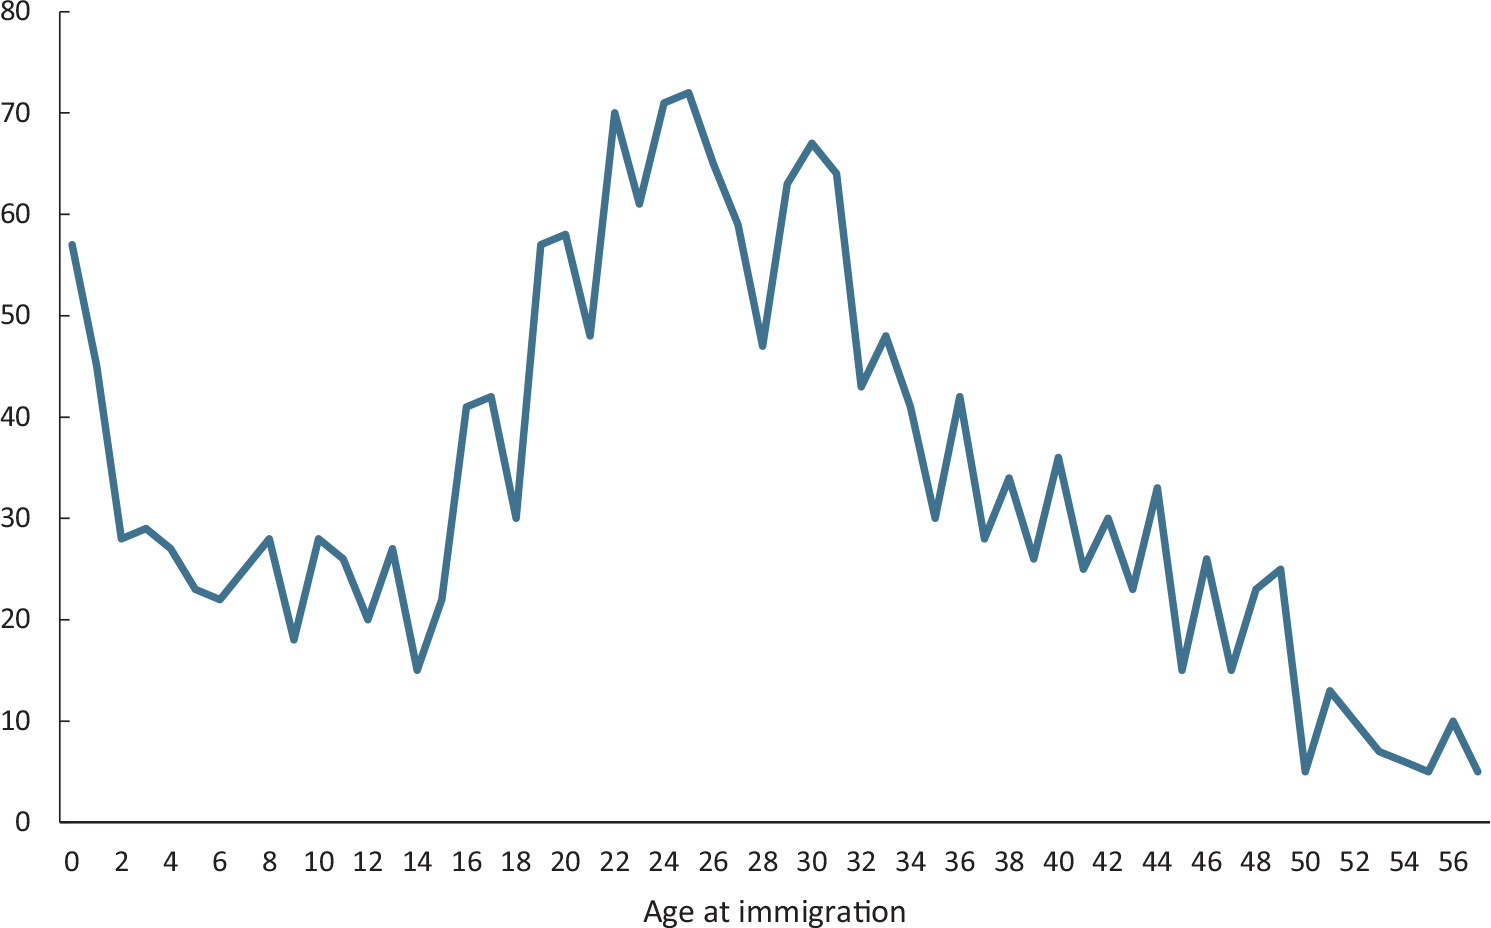
The figure can be read as follows: In 2007, 121 people lived in North-Varanger who had immigrated there. Of those, 56 still lived in North-Varanger in 2014, and 22 still lived there in 2021. For that year, only a sixth of the people who had immigrated to North-Varanger and lived there in 2007, still lived in North-Varanger in 2021. In other words, while there is high immigration to North-Varanger, the majority of immigrants do not stay. The reason for this is that many of those who immigrated to North-Varanger moved on to other parts of Norway. The number of immigrants living in North-Varanger has not increased for the past decade, and in the main scenario, we therefore assume net immigration to be zero. In the sensitivity section, we also include a sensitivity with an increased number of immigrants who move to North-Varanger and stay. For those immigrants, we use the age distribution of immigrants who live in North-Varanger in 2021, as shown in Figure 9.
Net internal migration rate within Norway
Both the local population and those who immigrated there have migrated from North-Varanger to other parts of Norway. The net number of the local population who have migrated from North-Varanger to other parts of the country has been between 50 and 200 each year since 2000, as can be seen in Figure 3. In the main scenario, we assume this will continue, and that the share of the local population that net migrates within Norway will remain at the average level for the last 20 years. To distribute internal migration by age, we have used data from SSB’s microdata.no to determine the ages of those who have migrated internally in and out of the municipalities in North-Varanger.
Source: Authors’ calculations using SSB’s microdata
Source: Authors’ calculations based on SSB’s microdata.

Source: Authors’ calculations based on SSB’s microdata.no
Figure 10 shows the distribution by age of those who migrate from and to Varanger, of people who were born in Norway. As can be seen, there is particularly high mobility among people in their early 20s, with more people moving out than in. In the older age groups, this gap narrows and approaches zero.
Results
Based on our model, we project that North-Varanger will undergo a significant population decline in the coming years. The region has already witnessed a decrease in population, falling from almost 16,000 inhabitants at its peak in 1974 to under 12,000 in 2021. Our analysis suggests that this trend will persist, with the population continuing to decline at a significant rate.
Furthermore, the municipalities of Vardø and Berlevåg have already experienced significant population declines over the last five decades. These municipalities have an aging population and higher outward migration rates compared to the other three municipalities, which implies that they are at risk of becoming depopulated unless effective measures are taken to reverse these historical trends.
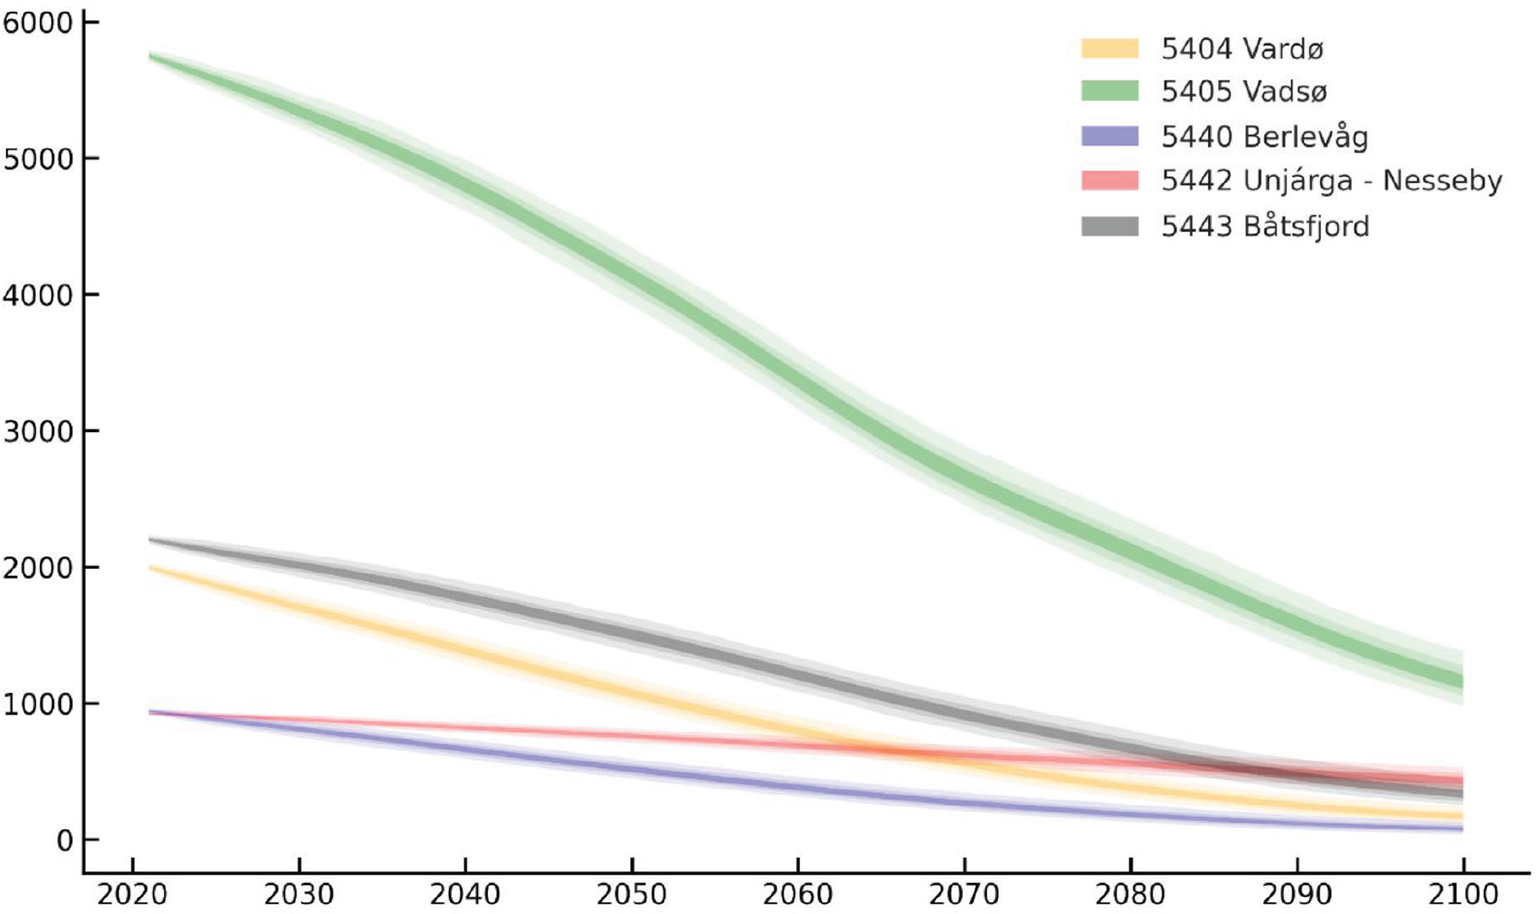
– Vardø had 4,000 inhabitants in 1970, 2,000 in 2020, and our model projects that the municipality will have 1,100 inhabitants in 2050, 550 in 2075, and just over 200 in 2100.

Source: Statistics Norway for historical data, projections by the authors
– Berlevåg had almost 2,000 inhabitants in 1970, with this number falling to under 1,000 in 2020. In our projections, the number of inhabitants will fall to around 550 in 2050. In 2075, less than 300 inhabitants will be left, and in 2100 there will be just about 100.
If trends continue in the way we model, Vardø and Berlevåg in 2100 will have around a ninth of the population they have today.
Båtsfjord is faring better than Vardø and Berlevåg, with a younger population and slightly lower outward migration. However, the municipality is facing a significant shortage of women, with almost 40 percent more men than women in the age group 20–40 years. As a result, Båtsfjord’s population decline will be slower until 2060, but after that, it is expected to fall rapidly due to smaller future cohorts. According to our projections, Båtsfjord’s population will fall by approximately 40 percent by 2060, from just over 2,200 inhabitants in 2020 to 1,300 in 2060, and then drop to just over 400 in 2100.
Vadsø is the only municipality in North-Varanger that has the same population size today as in 1970. The population grew from 5,600 in 1970 to over 6,400 at its peak in 1995, and back to just over 5,600 in 2021. Immigration has contributed greatly to this. In 1970, 70 immigrants lived in Vadsø, in 2021 there were 700.19 However, this is a clear drop from the peak in 2014-2018 when over 1,000 immigrants lived in Vadsø. The future of immigration in Vadsø is uncertain as it is unclear if there will be future immigration, and whether both new and current immigrants will stay. To account for these uncertainties, we have assumed that there will be no future immigration and that current immigrants will have a migration pattern similar to the local population. With these assumptions, Vadsø’s population will fall to 3,500 in 2060, and then fall further to around 1,400 in 2100.
Nesseby stands out as the municipality in North-Varanger with the lowest net outward migration of people born in Norway in the last 20 years. In this time period, only 30 more people born in Norway moved out than moved in. This has helped Nesseby maintain a relatively stable population from 2000 to 2020, going from 965 inhabitants in 2000 to 880 in 2021. Our projections assume that this low outward migration rate will continue, leading to the lowest population decline among the municipalities. Nevertheless, Nesseby’s population is projected to halve from its 2021 population of 880 to 460 in 2100.
What drives the population decline?
The population decline in North-Varanger is driven by a reduction in the number of women of childbearing age, which will result in smaller cohorts of children in the future. Moreover, young people tend to move away from the region, leading to a rapidly aging population. Figure 12 illustrates how the population composition is expected to change up to 2050.
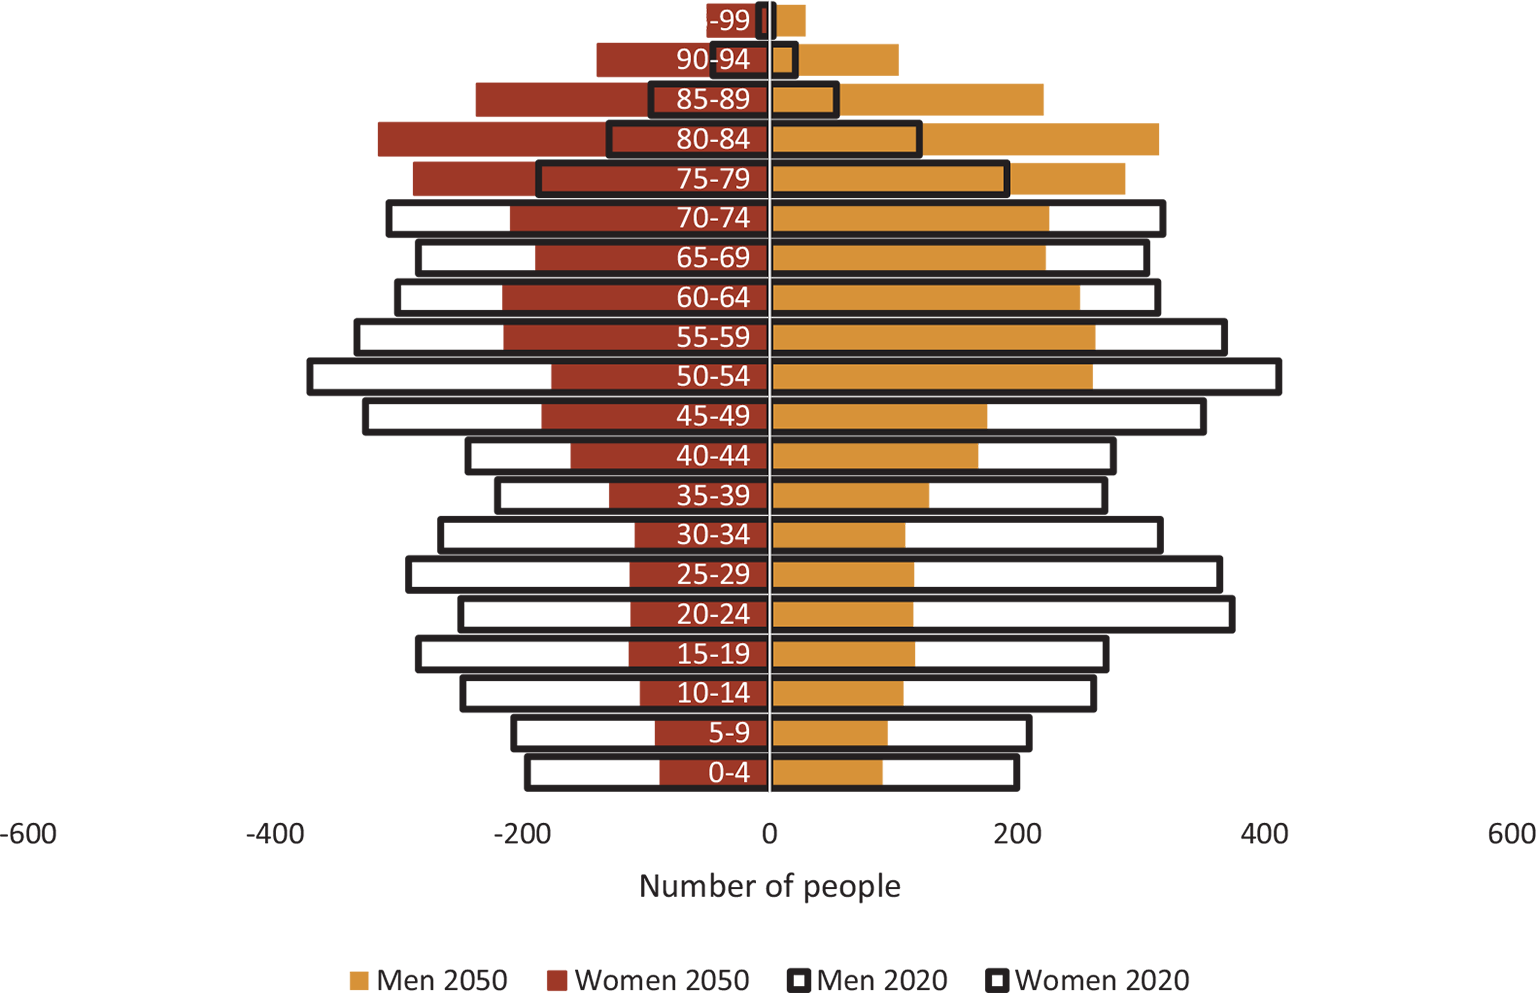
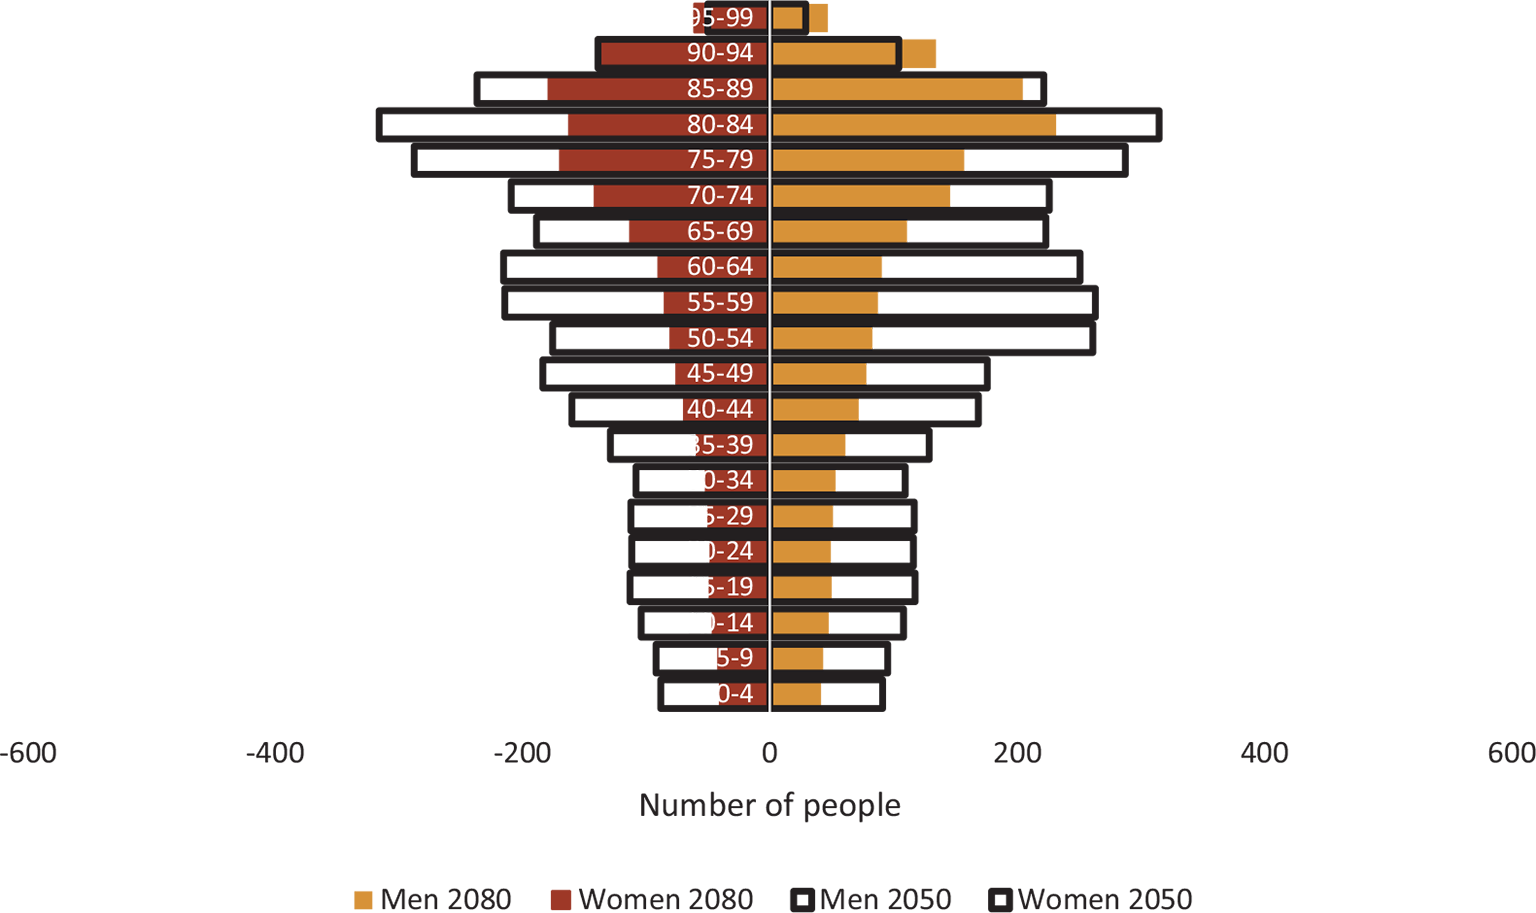
As the figure shows, the projections entail that 80-84-year-olds will be the largest group in 2050, and 0–4-year-olds the smallest. This creates a V-shaped population pyramid with more older people than young people. This trend worsens looking further ahead, as shown in Figure 13, which illustrates developments from 2050 to 2080.
The projections entail that from 2050 to 2080, the population in all age groups will shrink, except for women 90-94 and both women and men over 95 years.
Uncertainty and sensitivity
Population projections are inherently uncertain, and this uncertainty is confounded by both analysing far into the future and analysing a small area. Recent literature has highlighted that forecasting for small population groups is particularly challenging, because the actions of a few individuals may affect the outcome.20 Consider the extreme of modelling a 30-year-old couple’s family size next year. This too is affected by mortality and fertility rates, but stating that they will have on average 0.09 children this year is not very useful. However, when modelling a country with a million 30-year-old couples, then stating that they are likely to have 90,000 children in the year they are 30 will be close to the truth, but the smaller the area, the more uncertain this prediction will be. North-Varanger is so sparsely populated that we utilise a microsimulation population model to account for this uncertainty.
Microsimulation population methods, by definition, operate at the scale of individuals rather than populations groups.21 When modelling at the individual level, we can apply a probability that an event will happen, rather than deterministically stating that it will happen to a certain share of the population. If we take the 30-year-old couple from before, we model that the couple has a 9 percent probability of having a child in the year they are 30, instead of modelling that they have 0.09 children.
A benefit of using the microsimulation population method, is that it will have the same expected value as the cohort model we introduced above, but allows us to examine the uncertainty of the predictions.22
For each person, we model which outcome will happen in the next year. In a microsimulation model, life events occur in a sequential order. For a woman in the model, one of four outcomes will happen during the year: she can die, she can move out of North-Varanger, she can have a child, or none of the above. We draw a random number Ui to determine the outcome. If Ui < PDeathage, sex, she dies. If PDeathage, sex < Ui < PMigratesage, sex + PDeathage, sex, she migrates out of North-Varanger. If PDeathage, sex + PDeathage, sex < Ui < PMigratesage, sex + PDeathage, sex + PFertilityage, sex, she has a child and stays in North-Varanger. If Ui > PMigratesage, sex + PDeathage, sex + PFertilityage, sex, no event occurs.
If the woman dies or emigrates, she is removed from the population. If she is not removed, she ages a year. If she has a child, that child is added to the population. For men, the model is the same, with a fertility rate of 0. The probabilities applied are the same as in the cohort model above, and this ensures that we get the same results with the two methods. Figure 14 shows the uncertainty spans with this approach and 1000 simulations.
As can be seen, there is substantial uncertainty, which arises during the analysis period.
The table below shows the uncertainty span for the year 2100 in the main scenario for each municipality. It shows the population in the 1st percentile up to the 99th percentile, showing the uncertainty span of the model.
| 1st percentile | 10th percentile | 25th percentile | Median | 75th percentile | 90th percentile | 99th percentile | |
|---|---|---|---|---|---|---|---|
| Vardø | 166 | 197 | 210 | 231 | 252 | 262 | 292 |
| Vadsø | 1236 | 1297 | 1353 | 1414 | 1463 | 1496 | 1630 |
| Berlevåg | 67 | 81 | 89 | 101 | 111 | 124 | 149 |
| Nesseby | 362 | 417 | 438 | 459 | 493 | 517 | 569 |
| Båtsfjord | 326 | 376 | 407 | 432 | 468 | 503 | 515 |
The different simulations provide highly variable results, especially for the smaller municipalities. For Berlevåg, the population is more than twice as large in the 99th percentile as in the 1st percentile. For the larger municipalities, the uncertainty span is lower in relative terms, but nonetheless relatively large.
It is important to emphasise that these intervals quantify the uncertainty conditional on the model inputs being correct. The largest uncertainty is likely not to stem from the model specification, but from the assumptions about how the inputs will develop: will fertility rise, or will it fall? Will immigration return? Will mortality rates continue to fall? In the next chapter, we examine this.
Scenarios
Population projections are inherently uncertain, particularly when forecasting 80 years into the future. To account for this uncertainty, we have conducted three sensitivity analyses. These include:
– Immigration scenario: This scenario assumes that net internal migration levels to each municipality remain constant from 2017-2020.
– No migration scenario: In this scenario, we assume that there is no inward or outward migration to or from the municipalities. This scenario provides insight into the development of the local population without external influences.
– Increased fertility scenario: This scenario assumes a gradual increase in fertility rates for women up to 2036, which is consistent with Statistics Norway’s projections. This translates to a 15 percent increase in fertility.
Figure 15 displays three sensitivity analyses along with the main scenario. In the no-migration scenario, the population remains stable until 2030, after which it begins to decline slightly as the population ages. Despite this, the number of births and deaths remains roughly the same. From 2040, the decline accelerates, as more people in the aging population die, and new cohorts become smaller and smaller. This scenario predicts that around 7,500 people will live in North-Varanger in 2100, indicating that reduced outward migration alone cannot solve the region’s population issues.

In the immigration scenario, the population is expected to decline to approximately 5,600 people by 2100. This implies that in 2100, more of the residents will be immigrants or their children who arrived between 2020 and 2100 than residents who are descended from the current population in North-Varanger.
Increased fertility results in a population decline similar to the main scenario, but with a slightly smaller population reduction. Increased fertility results in some more births, especially after 2050, but the population is still expected to decline to around 3,000 by 2100. This means that a 15 percent increase in fertility until 2036 does not substantially contribute to solving the population decline issue.
How do our projections differ from other analyses?
To our knowledge, we are the only ones who have developed projections up to 2100 for North-Varanger. Statistics Norway has projections up to 2050, while Telemarksforskning has made projections up to 2040.23 Figure 16 shows a comparison between our main scenario, our immigration scenario, our no-migration scenario, Telemarksforskning’s neutral alternative, Telemarksforskning’s estimates based on historical trends, and Statistics Norway’s main alternative.24
The main scenario, the immigration scenario and the two scenarios for Telemarksforskning give relatively similar results for North-Varanger for the period up to 2040. Telemarksforskning’s two scenarios both lie between this report’s main scenario and the immigration scenario. The no-migration scenario results in only a slight decrease by 2040. Statistics Norway’s main alternative projects a population increase until 2040. This means that Statistics Norway stands out quite clearly from the others. The difference until 2040 is shown in Figure 16.
The forecast from Statistics Norway shows a stable population. This is not only the case for North-Varanger. According to the committee studying demographic developments in rural Norway25 this is due to Statistics Norway assuming there will be several stabilizing forces: a decline in the number of youths, which will result in less relocation, as only a small number of youths will relocate from cities to rural areas, and continued immigration from abroad.
The difference in forecasts between our model and Statistics Norway’s is not primarily due to model choice, but is instead a result of underlying assumptions. The main scenario in this article assumes that immigration will not return, and that internal migration will continue at the same pace it has for the past 30 years. That may not necessarily be the case, and Statistics Norway may be correct. However, the stabilising factors utilized by Statistics Norway are highly uncertain. It may be that they do not happen, and that past trends continue – as in the main scenario presented here. We therefore consider it important to have clearly defined scenarios which outline what may happen if past trends do not change.

Discussion
The objectives for regional policy are being challenged
For a long time, it has been a stated goal of the Norwegian authorities to preserve the distinct features of settlement patterns. This goal has had broad political support, even though this goal was formulated somewhat less decisively in the latest report to the parliament on rural and regional policy. In the 2021 election, however, there was a majority for the parties that formulated the goals in the previous report. The new government’s political platform states:
Regional policy must be strengthened and renewed. The government will pursue a policy for stronger community, growth and development throughout the country where cities and country go hand in hand. We will initiate new measures to create optimism and confidence in the future throughout Norway. …
To exploit the opportunities in the north, population decline must be turned into population growth.26
Our findings show a development that is completely contrary to the government’s political ambition.
Projection with considerable uncertainty
A population projection 80 years into the future will necessarily have considerable uncertainty. Major changes can occur nationally and globally over such a long period, during which weaknesses in our assumptions for the calculations will also have a greater impact. However, this is a period of time which is equally far away in time as the end of the Second World War, which is still an important reference point for debate about social development.
It is important to note that North-Varanger has experienced net outward migration throughout the entire post-war period. Of course, global changes in climate can affect living conditions in the area. Changes in sea temperatures may change the migration patterns of cod. These are changes that the global authorities will try to avoid as far as possible. The geopolitical situation and question of future relations with Russia is also a source of substantial uncertainty.
Despite the uncertainties associated with long-term population projections, our findings offer valuable insights into future challenges for settlement in North-Varanger, unless long-term trends are changed. Increasing the birth rate does not significantly alter the projected outcomes. Our projections are consistent with the challenges highlighted by the advisory committee for demographic development in rural Norway and the committee for rural and regional commerce and industry, albeit our study provides a more detailed analysis of the situation.
Drawing on the findings of our research, we can confidently conclude that if the underlying factors driving the decline in population are not addressed, the prospect of settlement in North-Varanger over the course of this century is bleak. The challenges faced by this region are not unique, and also serve as an illustration of the potential obstacles that other remote areas may encounter. In this way, our research serves as a valuable contribution to the discourse surrounding the difficulties facing rural and remote regions in Norway and beyond.
Is the population decline a topic for continued concern?
The impending depopulation of rural areas is not a new issue. Both North-Varanger and many other rural areas in Norway and other countries have already seen a population reduction. In Sweden, there is substantial literature on the population decline that many small Swedish municipalities have seen. Syssner (2018) states that for the small municipalities “[t]here is much evidence that it will be like this in the future as well, and the small municipalities need to prepare themselves for the challenges it brings” [authors’ translation].27 Syssner finds that population decline has traditionally been countered by attempts to create population growth. Moreover, she finds that continued population decline is not only a reality in a large part of Swedish municipalities, it is also a result of processes which are difficult for individual municipalities to influence. She therefore calls for politicians who dare to break with the population growth strategy and “reflect around how the society can be if the population decline continues”.28 She calls for a policy of adaptation. According to Syssner this is not a question related to budget reductions only, “it is about what kind of society one wants to live in … what kind of future one wants to take part in shaping”.29
In line with this, the committee studying demographic developments in rural Norway also concluded that “It is the good society which is set as the goal for the future, not population growth by itself”.30
Even if the committee’s policy should be defined as national policy, special attention needs to be addressed to North-Varanger. The fact that this region makes up a border area next to Russia gives the area a significant strategic position. It seems unthinkable that Norway would leave this area without military defence. Nonetheless, national strategic interests in the area also call for a presence in a broader context.
In the Fiscal Budget for 2023 the government highlighted this:
The government will renew and strengthen efforts in the High North and has big ambitions for Northern Norway. Norwegian settlement in Northern Norway has been a national political goal for centuries. This policy has given Norway sovereignty over large areas on land and in the sea, with enormous natural resources of great value. The settlement in the northernmost part of the country is of great importance for the country as a whole. Here the demographic challenges are greatest, the distances longest, and here we have borders with several of our neighbouring countries, including Russia. The change in the population in the Sami areas gives causes for concern. Sustainable Sami local communities are a prerequisite for strengthening and development of the Sami language, culture and community life.31 (authors’ translation)
The importance of the projections in this article is even more substantial considering the strategic position of the border areas. The region has had a continuous decline in population for decades, but our projections reveal that the impending decline is likely to be much more drastic than the past decline, and much harder to reverse.
In relative terms, the decrease in population North-Varanger is accelerating. In the main scenario, the population drops from 12,000 in 2020 to 8250 in 2050 to 4500 in 2080 to 2600 in 2100. That is a decrease of 30 percent over the first 30 years, which then accelerates to a decrease of 45 percent over the next 30 years (from 2050 to 2080). Over the final 20 years up to 2100, the population decrease is over 40 percent.
The shorter-term perspectives do not fully show how the short-term lays the foundation for the long term, and unless trends change substantially, the population decrease will accelerate over the next 80 years.
This is what this article is about. The article does not pretend to give a precise answer to the question of how the population in North-Varanger will change in a distant future. The long timeline contains too many elements of uncertainty to do that. Nonetheless, the projections reveal that under a reasonable set of assumptions, the population in North-Varanger will be decimated at the end of this century. Therefore, this is not a question of preparing and adapting to a future with some decline in the population. It is an alarm warning that it is not unlikely that Norway can face a future where the population breaks down in one of the country’s strategically most important areas.
Population thresholds for societal collapse
In our main model, the tendency to migrate out of North-Varanger to other parts of Norway is constant over the analysis period. There is substantial uncertainty about this assumption, especially as the population decreases. At some point, the population in some or all the municipalities may reach a critical level where sustaining a functioning society becomes very difficult. There are many utilities and public services that a modern society needs: schools, grocery stores, elderly care, healthcare, and recreational activities. As the population decreases, sustaining these services will become harder and harder, and North-Varanger will become a less and less attractive place to live. It is likely that there are some thresholds for a minimum population in an area before there are so few people that a modern society can no longer be sustained.
What those thresholds are, however, is uncertain and left for future research. We have shown that if current trends continue, North-Varanger’s population will be decimated by the end of the century, but our methodology does not allow us to estimate the risk that the basis for settlement will collapse entirely.
Future settlement depends on migration to the region
Our results indicate that the only factor that can cause a sustainable settlement in this area over time is significant net inward migration, either of Norwegians or from abroad. Our no-migration scenario demonstrates that halting outward migration alone is insufficient to maintain the population. To have a lasting effect, inward migration should consist of individuals who are at a reproductive age, capable of increasing population growth. Such a situation places other demands on the organization of, and the strength of, the instruments for regional policy. Whereas previously the focus was on making it attractive to establish jobs, the challenge now is to make it attractive for young people from the outside to establish themselves as residents. There is no contradiction between these two approaches. The attractiveness of moving to the area depends on the availability of interesting workplaces.
To make relocation to North-Varanger attractive, interesting workplaces is a necessary, but not sufficient, condition. The overall residential attractiveness of the area is decisive, and this is influenced by a range of factors, including access to welfare services, other services, and economic incentives such as tax breaks and write-downs of student loans. It is reasonable to assume that it is the sum of the availability of workplaces, welfare services, other service offers and financial benefits that determines whether the attractiveness is sufficient.
The development in the population numbers up to now shows that today’s extensive government measures to support the establishment of jobs in industry and commerce, financing of municipal welfare services and personal financial benefits have not been sufficient to attract people wishing to move from elsewhere. A further question then is who North-Varanger should be attractive for. It is worth noting that these measures may have a greater impact on potential immigrants than on Norwegians living in more central areas of the country. The measures should be targeted to not only incentivise just anyone to move to North-Varanger, but target those who may want to stay in North-Varanger and create families there.
Conclusion
This analysis highlights the risk of a drastic decline in population in North-Varanger in the coming decades. This is contrary to stated political objectives. A significant increase in the migration of young individuals capable of contributing to population growth is necessary to ensure sustainable settlement. However, it is important to note that the overall attractiveness of the area plays a crucial role in this regard, encompassing not just job opportunities but also access to welfare services, financial incentives, and other service offers. The current public measures aimed at supporting private businesses, financing welfare services, and providing personal financial benefits have not been sufficiently effective either in attracting migrants from outside the region or in making them stay. Therefore, it is crucial to consider whether these measures need to be further strengthened or reorganized to make the area more appealing to potential migrants.
NOTES
- 1. See for example Michaels, G., Rauch, F., & Redding, S. J. (2012). Urbanization and structural transformation. The Quarterly Journal of Economics, 127(2), 535–586. https://doi.org/10.1093/qje/qjs003., 2–6.
- 2. See for example Fujita, M., & Thisse, J. (2002). Economics of Agglomeration: Cities, Industrial Location, and Regional Growth. Cambridge University Press., 339–347 and 368–374.
- 3. See for example Bairoch, P. (1988). Cities and Economic Development. University of Chicago Press., 1–7.
- 4. UN World Urbanization Prospects (2018). https://esa.un.org/unpd/wup/Download/.
- 5. St. meld. nr. 85 (1951) Utbyggingsprogrammet for Nord-Norge. Ministry of trade., 1–9
- 6. Innst. S. nr. 141 (1989–90), Innstilling fra finanskomiteen om tiltakssone i Finnmark og Nord-Troms (St. prp. nr. 64)., 3.
- 7. The excess of births over deaths is defined as the difference between the number of people who are born and the number who die. Net migration is here shown as total net migration, i.e., the sum of net immigration to the country and net internal migration. The sum of net migration and excess of births over deaths makes up the total population change.
- 8. There has still been net immigration to the region, but more immigrants have moved to other municipalities from North-Varanger than new immigrants to North-Varanger.
- 9. Brox, Ottar. ”Hva skjer i Nord-Norge?: en studie i norsk utkantpolitikk.” (1966).
- 10. See for example Schjøtt-Pedersen, K. E. (ed.) (1990), Fra problemer til muligheter. Framtid i Nord-Norge. Tiden Norsk Forlag”; Eriksen, E. O. (ed.) (1996). Det nye Nord-Norge. Avhengighet og modernisering i nord. Fagbokforlaget; and Stein, J. (2019). What Happened in Northern Norway? A comparative and quantitative analysis of political and demographic development in Northern Norway from 1950 to 2015. UiT The Arctic University of Norway. https://doi.org/10.1080/21622671.2019.1624191., 1–4.
- 11. Ministry of Local Government and Modernisation (2020 NOU 2020: 15. (2020). Det handler om Norge. Bærekraft i hele landet. Utredning om konsekvenser av demografiutfordringer i distriktene. Ministry of Local Government and Modernisation., 17.
- 12. Meld. St. 5 (2019–2020) Levende lokalsamfunn for fremtiden – Distriktsmeldingen. Ministry of Local Government and Regional Development., 9
- 13. ‘Distriktsdemografiutvalget’ [authors’ translation].
- 14. Ministry of Local Government and Modernisation (2020 NOU 2020: 15. (2020). Det handler om Norge. Bærekraft i hele landet. Utredning om konsekvenser av demografiutfordringer i distriktene. Ministry of Local Government and Modernisation., p. 181 [authors’ translation]
- 15. ‘Distriktsnæringsutvalget’ [authors’ translation].
- 16. NOU 2020: 12. (2020). Næringslivets betydning for levende og bærekraftige lokalsamfunn. Ministry of Trade, Industry and Fisheries., pp 169–70 [authors’ translation]
- 17. Gleditsch, R. F., Thomas, M. J., Syse, A. & Thomas, M. (2021). The accuracy of Statistics Norway’s national population projections.
- 18. See for instance Wilson, T., Grossman, I., Alexander, M. et al. Methods for Small Area Population Forecasts: State-of-the-Art and Research Needs. Popul Res Policy Rev 41, 865–898 (2022). https://doi.org/10.1007/s11113-021-09671-6
- 19. Here we refer to the number who have immigrated themselves, and not children of immigrants, as per Statistics Norway’s table 07110.
- 20. Wilson, T., Grossman, I., Alexander, M. et al. Methods for Small Area Population Forecasts: State-of-the-Art and Research Needs. Popul Res Policy Rev 41, 865–898 (2022). https://doi.org/10.1007/s11113-021-09671-6
- 21. Van Imhoff, E., & Post, W. (1998). Microsimulation methods for population projection. Population: an English selection, 97–138.
- 22. Jia, Z., Leknes, S., & Løkken, S. A. (2023). Moving beyond expectations. From cohort-component to microsimulation projections.
- 23. Telemarksforskning (2020). Regional analyse. https://2020.regionalanalyse.no/distrikt.
- 24. The scenario with increased fertility provides similar results as the main scenario in the period up to 2040. Therefore we do not include it in the illustration to make the figure more readable.
- 25. Ministry of Local Government and Modernisation (2020 NOU 2020: 15. (2020). Det handler om Norge. Bærekraft i hele landet. Utredning om konsekvenser av demografiutfordringer i distriktene. Ministry of Local Government and Modernisation., p. 12
- 26. Hurdals-plattformen. Regjeringsplattform for en regjering utgått fra Arbeiderpartiet og Senterpartiet 2021–25. https://www.regjeringen.no/no/dokumenter/hurdalsplattformen/id2877252/., 34 [authors’ translation]
- 27. Syssner, J. (2018), Mindre många. Om anpassning och utveckling i krympande kommuner (Less many. About adaption and development in municipalities with declining population (AT)), Årsta, Dokument Press., 137 [authors’ translation]
- 28. Syssner, J. (2018), Mindre många. Om anpassning och utveckling i krympande kommuner (Less many. About adaption and development in municipalities with declining population (AT)), Årsta, Dokument Press., 57 [authors’ translation]
- 29. Syssner, J. (2018), Mindre många. Om anpassning och utveckling i krympande kommuner (Less many. About adaption and development in municipalities with declining population (AT)), Årsta, Dokument Press).,138 [authors’ translation]
- 30. Ministry of Local Government and Modernisation (2020 NOU 2020: 15. (2020). Det handler om Norge. Bærekraft i hele landet. Utredning om konsekvenser av demografiutfordringer i distriktene. Ministry of Local Government and Modernisation., 14
- 31. Ministry of Local Government and Regional Development (2022), Prop. 1 S (2022–2023) For budsjettåret 2023 under Kommunal- og distriktsdepartementet Utgiftskapitler: 1–2, 500–595, 2412, 2445 Inntektskapitler: 3500–3595, 5312, 5570, 5607, 5615–5616., 19.